LinkedIn analytics that
actually show you pipeline.
Track post performance, team analytics, and follower growth in one dashboard. Then see exactly who engaged with your content — and reach out while intent is hot.
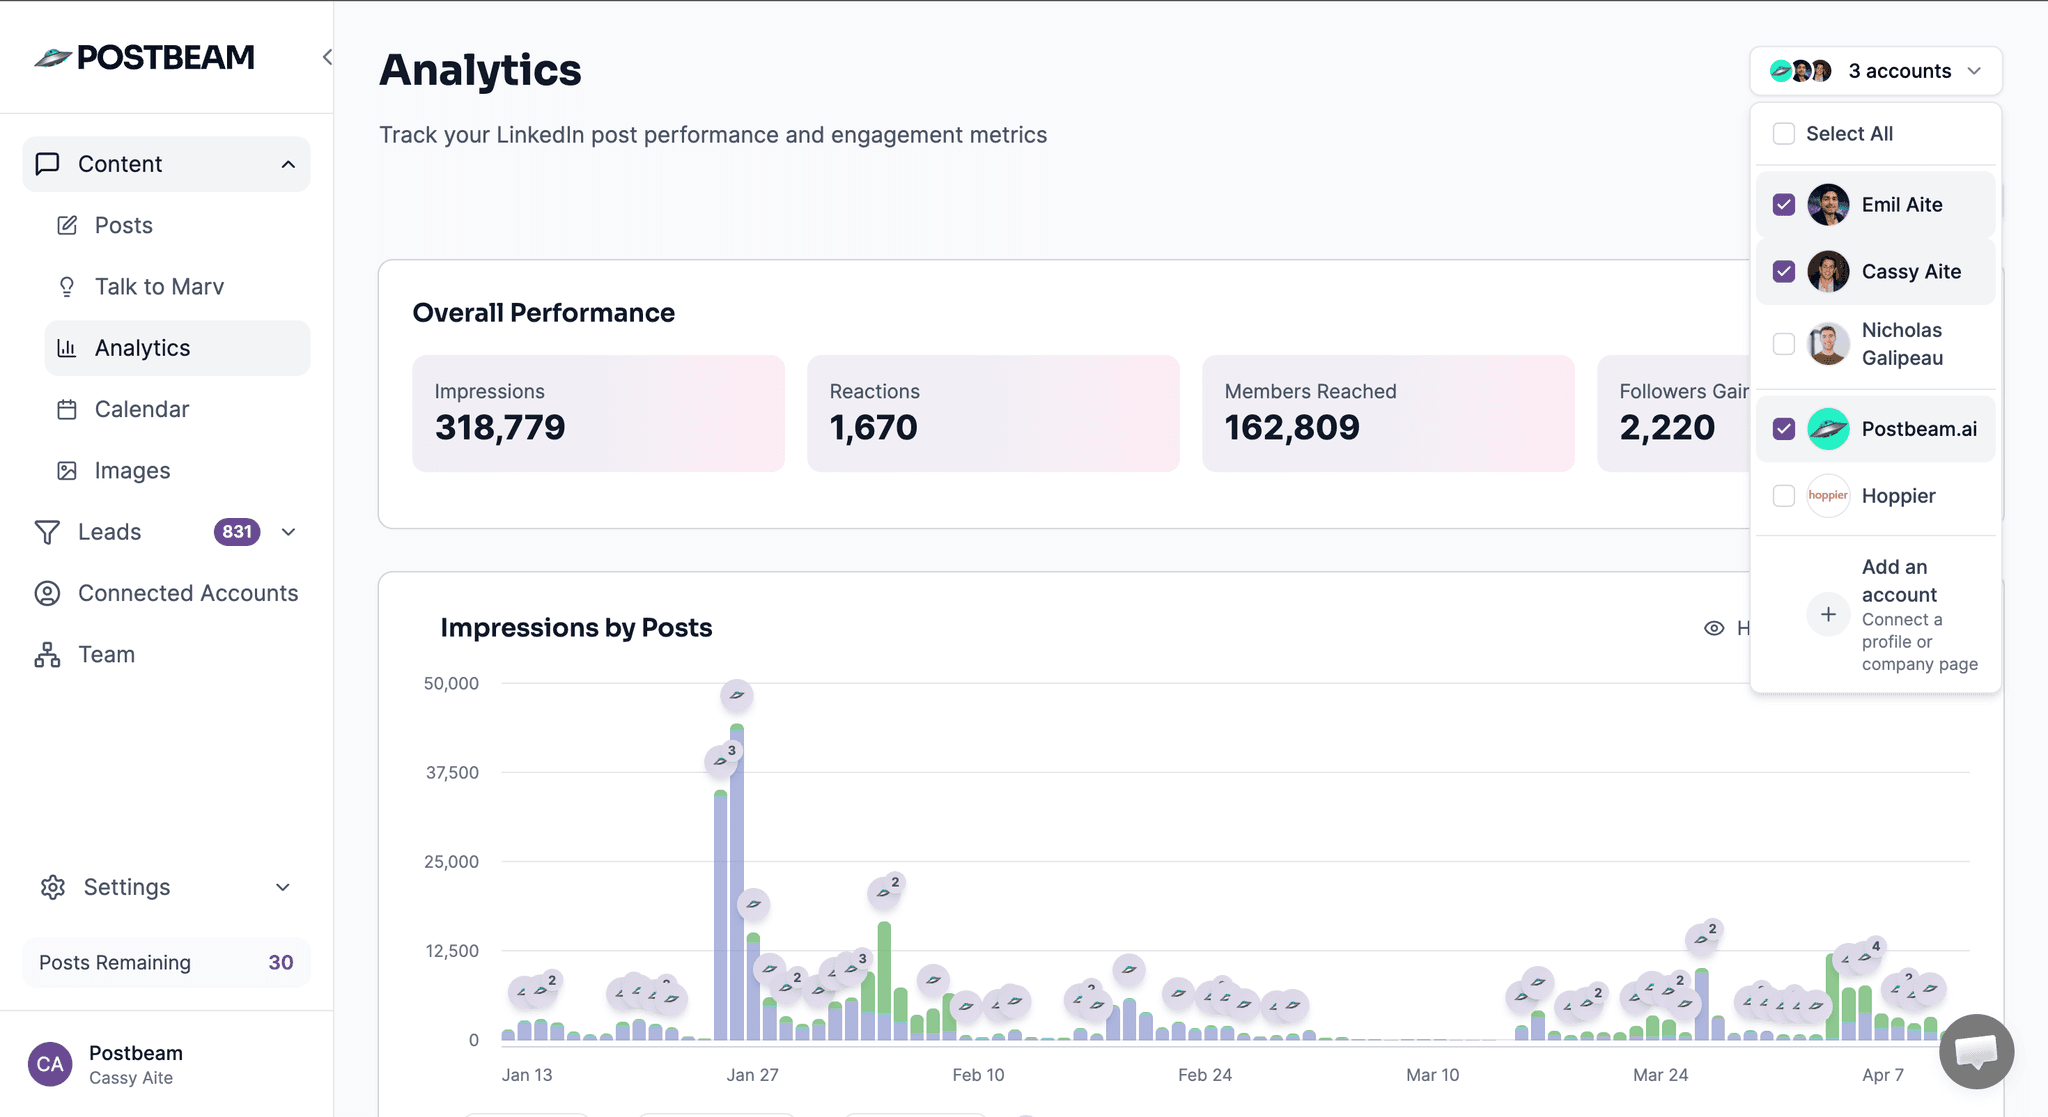
318K+
Impressions tracked
2,220+
Followers gained
1,670+
Reactions tracked
162K+
Members reached
Agencies and B2B teams tracking LinkedIn analytics with Postbeam


Up and running in 5 minutes
No setup calls. No CSV uploads. Just connect and go.
Connect your team
Link each team member's LinkedIn account in one click. Postbeam starts pulling analytics immediately.
Track every post
See impressions, engagement rate, and follower growth for every person on your team — all in one dashboard.
Act on the data
See who engaged with your posts, filter by ICP, and reach out while intent is hot. Or export to AI for instant insights.
See Postbeam in action
Watch how B2B teams use Postbeam to track LinkedIn analytics and turn engagement into pipeline.
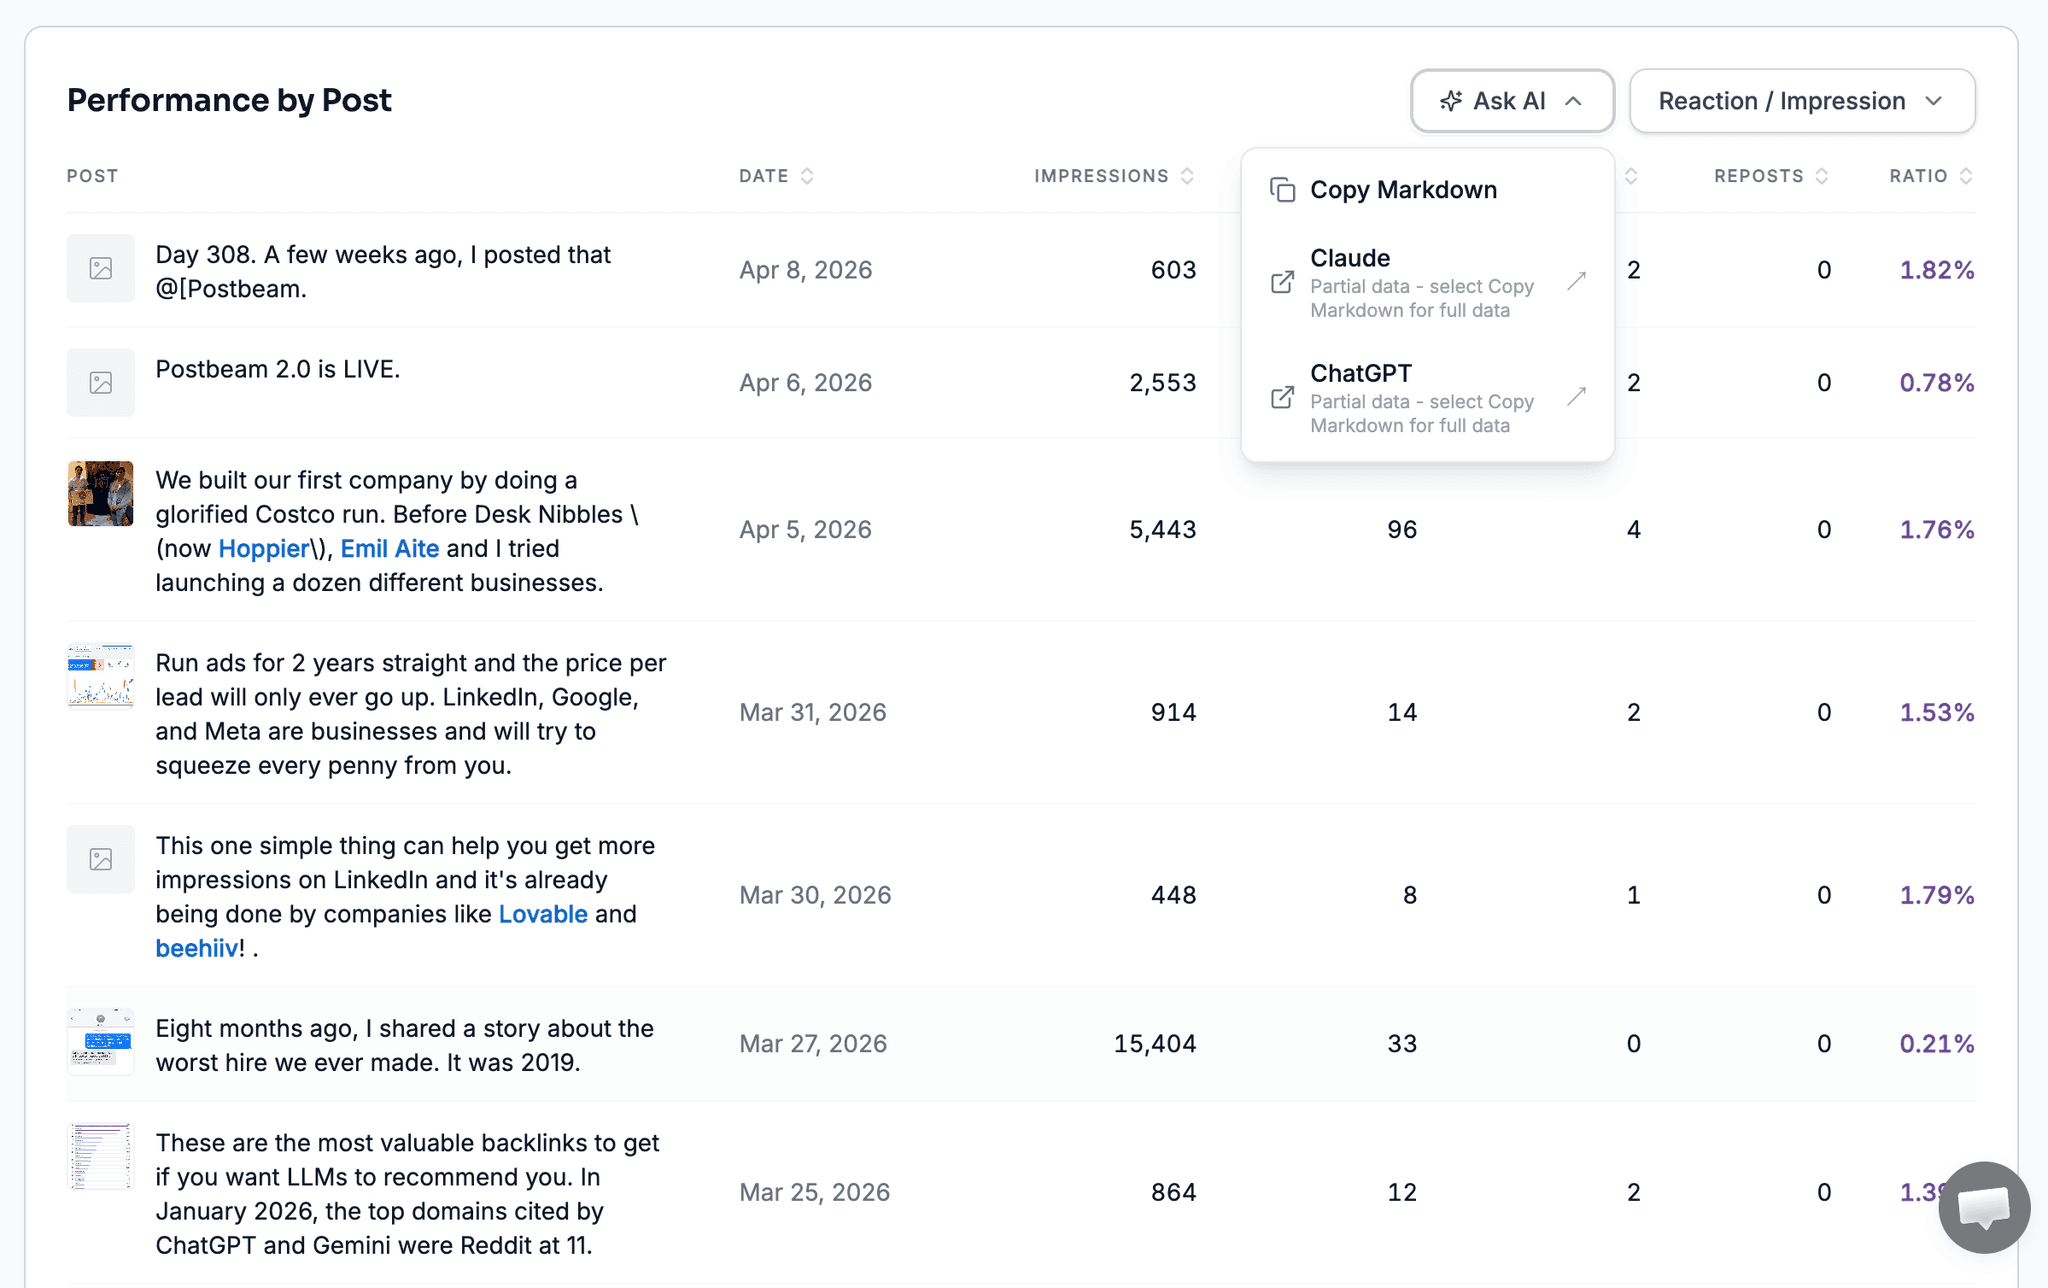
Open your LinkedIn analytics in Claude with one click
Postbeam has a built-in button that sends all your analytics data directly into Claude or ChatGPT — no copy-paste, no CSV, no setup. Just click and ask.
1Your post analytics in Postbeam
Click one button
2Claude analyzes your data instantly
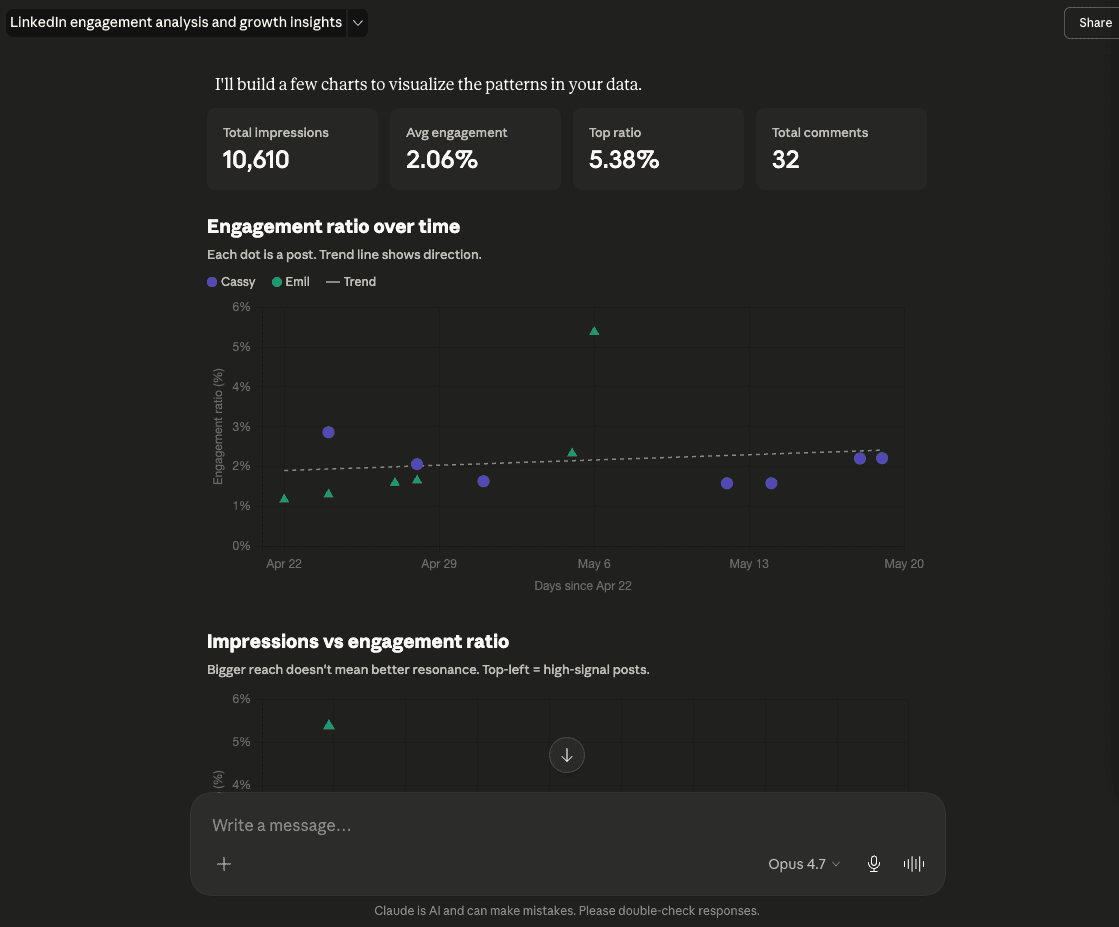
Claude builds the charts, spots the trends, and tells you what to post next — using your actual data.
What teams say about Postbeam
In their own words.
“I'm obsessed with Postbeam. The gap it fills in my content pipeline is social listening — the conversations my ICP is engaged in on LinkedIn.”
Hillary Lyons
Founder & CEO, Syntropy
“We come across hot leads within our ICP that we otherwise wouldn't have seen. It's been a really awesome way to open doors.”
Danika Chilibeck
Co-Founder & Head of GTM, Caddie AI
“I've seen a significant increase in impressions, engagements, DMs, and connections on LinkedIn. Everything has elevated since using Postbeam.”
Tyler Troutman
Employee Benefits Advisor, The Baldwin Group
“Postbeam lets me schedule for my clients, coordinate the approval loop, and get a post from an idea all the way to live on their LinkedIn.”
Hooman Khoramshahi
Co-Founder & CEO, ContentViking
Everything LinkedIn analytics should do — but doesn't.
LinkedIn's native analytics cap at 1 year, hide who engaged, and show nothing about your team. Postbeam fixes all of that.
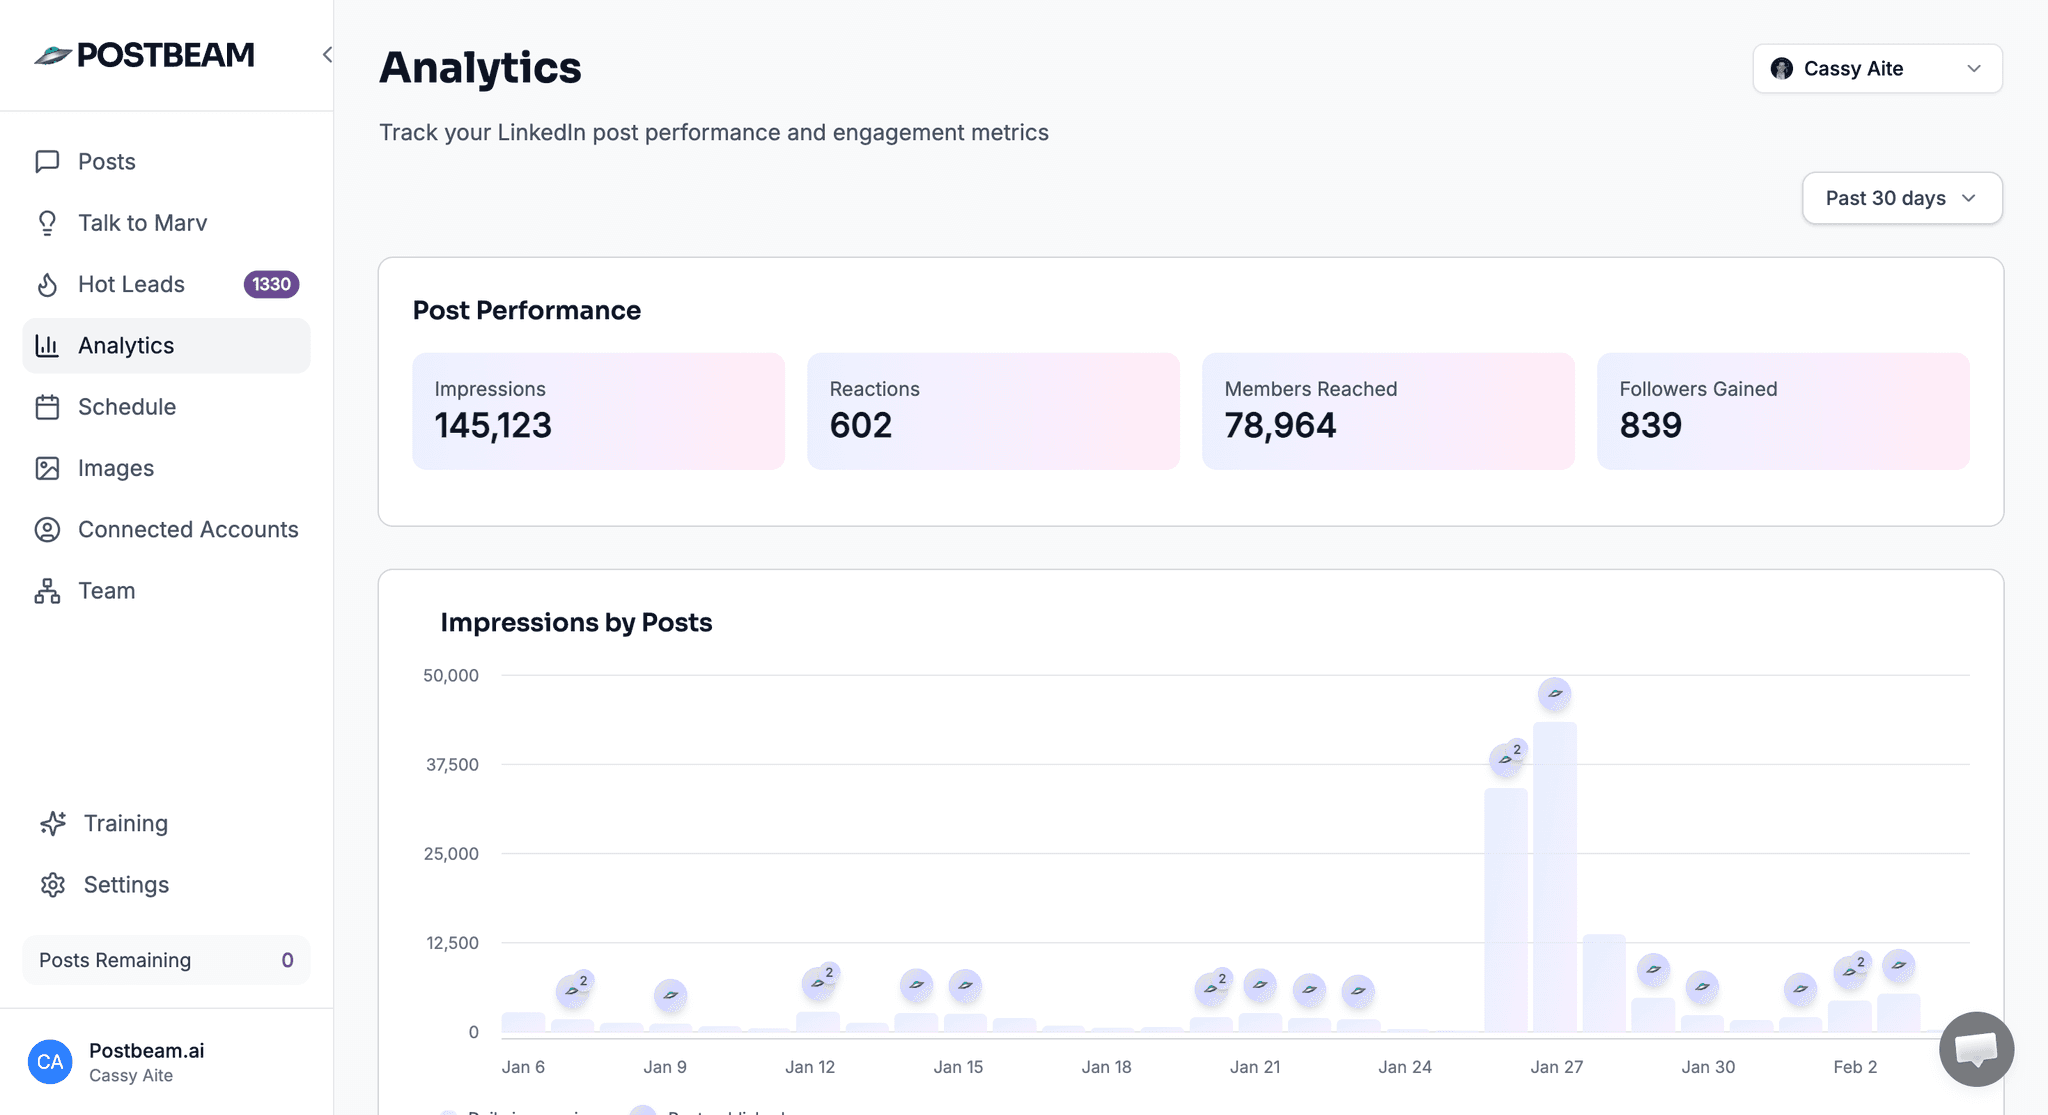
Post performance analytics
See impressions, engagement rate, reactions, comments, and reach for every post. Filter by time range to find what's working.
Team analytics dashboard
Compare performance across every team member side by side. See who's posting, who's growing, and which content is moving the needle.
Follower growth tracking
Track follower growth over time for every person on your team. Understand which content drives audience growth vs. just impressions.
Engagement rate by post
Sort posts by engagement rate to find your best-performing content formats. Stop guessing — let the data tell you what to post next.
See who's engaging with your posts
LinkedIn's native analytics hide the people behind your numbers. Postbeam shows you every person who liked or commented — with their job title and company.
Export reports
Download your analytics as a CSV. Share performance reports with leadership, clients, or your board — no screenshots needed.
One dashboard for your whole team's LinkedIn performance
LinkedIn only shows you your own analytics. Postbeam shows you everyone — impressions, engagement rate, follower growth, and top posts for every team member, side by side.
- Compare performance across team members
- Filter by time range or individual
- See top posts ranked by engagement rate
- Export team reports for leadership or clients
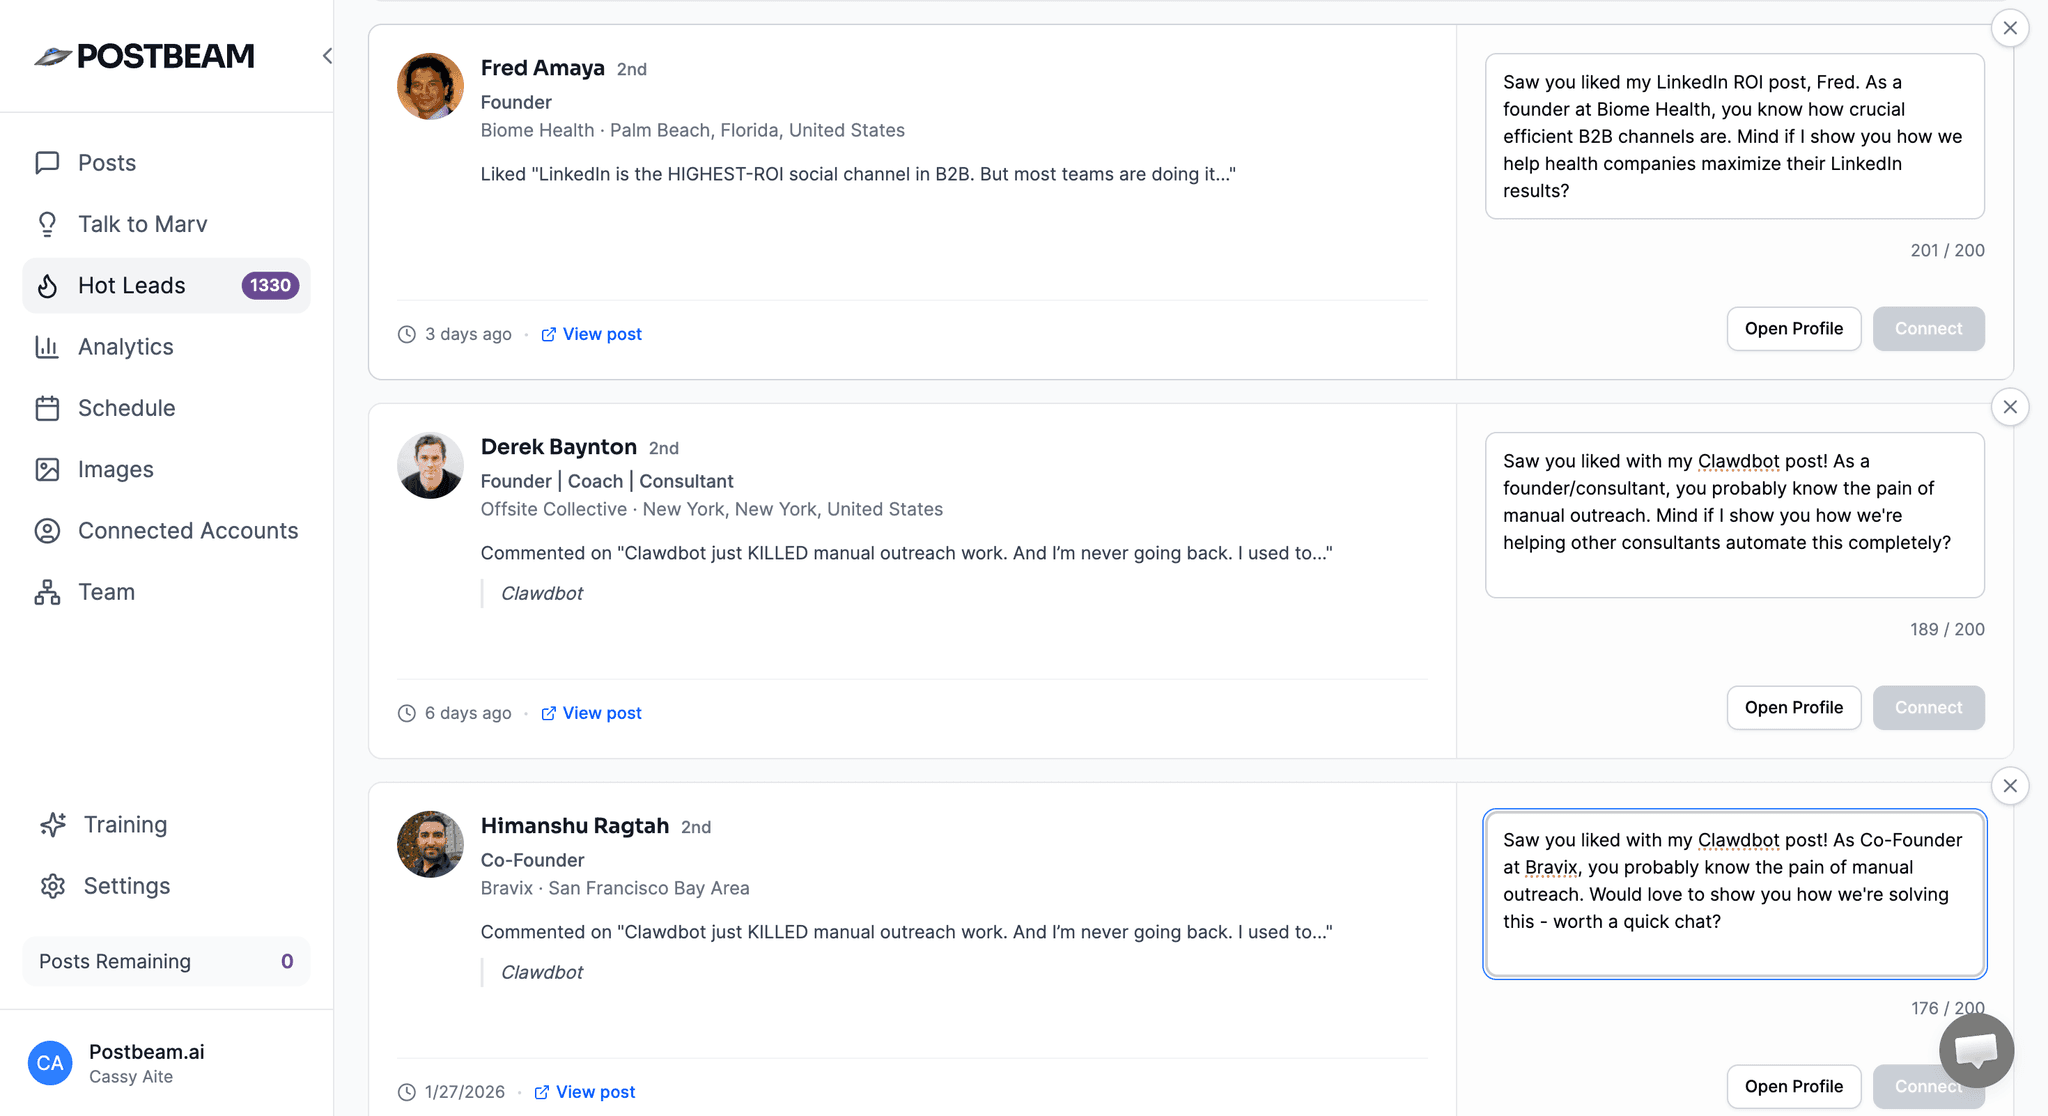
See who liked and commented — not just how many
LinkedIn shows you a number. Postbeam shows you the people. Every like and comment on your posts reveals a potential buyer — filter by job title, company, or seniority and reach out while their interest is fresh.
Postbeam vs. LinkedIn native analytics
LinkedIn gives you the basics. Postbeam gives you the full picture.
| Feature | Postbeam | |
|---|---|---|
| Post impressions & reach | ||
| Engagement rate per post | ||
| Team analytics (multi-user) | ||
| Follower growth over time | Limited | |
| See who liked & commented | ||
| Filter engagers by ICP | ||
| Historical data beyond 365 days | ||
| Export to CSV | ||
| Slack notifications for post activity |
Common questions
How is Postbeam different from LinkedIn's built-in analytics?
LinkedIn's native analytics are per-post and per-person — there's no team view, no engagement rate sorting, and you can't see who specifically liked or commented. Postbeam gives you a unified dashboard across your whole team, shows you the people behind every engagement, and lets you filter them by job title, company size, and industry.
Can I track multiple LinkedIn accounts?
Yes. Postbeam is built for teams. Connect as many LinkedIn accounts as you have team members and see everyone's performance in one place.
Does it work for personal profiles and company pages?
Postbeam primarily tracks personal profile analytics, which is where most B2B content and pipeline actually comes from. Company page analytics are on the roadmap.
How far back does the historical data go?
Once connected, Postbeam continuously tracks your data. LinkedIn limits historical imports to your most recent posts, but going forward you'll have a complete record.
Is there a free trial?
Yes — 7 days free.
Start tracking your LinkedIn analytics today.
Set up in minutes. Connect your team, see your analytics, and start turning post engagement into pipeline.